
ML-Powered Energy Demand Forecasting
We built an ML model to help an energy provider forecast consumption and plan supply more reliably.


Client
Baseline Energy is a Norway-based electricity retailer. The company purchases electricity on the wholesale market and resells it to both businesses and individual customers.
To plan procurement volumes accurately, the client needed a reliable forecasting tool. In 2021, Baseline Energy approached us to build a machine learning–based solution for energy demand prediction. Predictive analytics is one of our core capabilities.
Challenges
Before this project, Baseline Energy relied on manual forecasting. The team estimated expected consumption and submitted procurement requests to energy producers based on those figures.
The accuracy of these forecasts was around 92%, which was sufficient under stable conditions. However, during peak periods, even small deviations led to additional costs.
The goal was to improve forecast accuracy with a machine learning model and reduce losses caused by demand fluctuations.
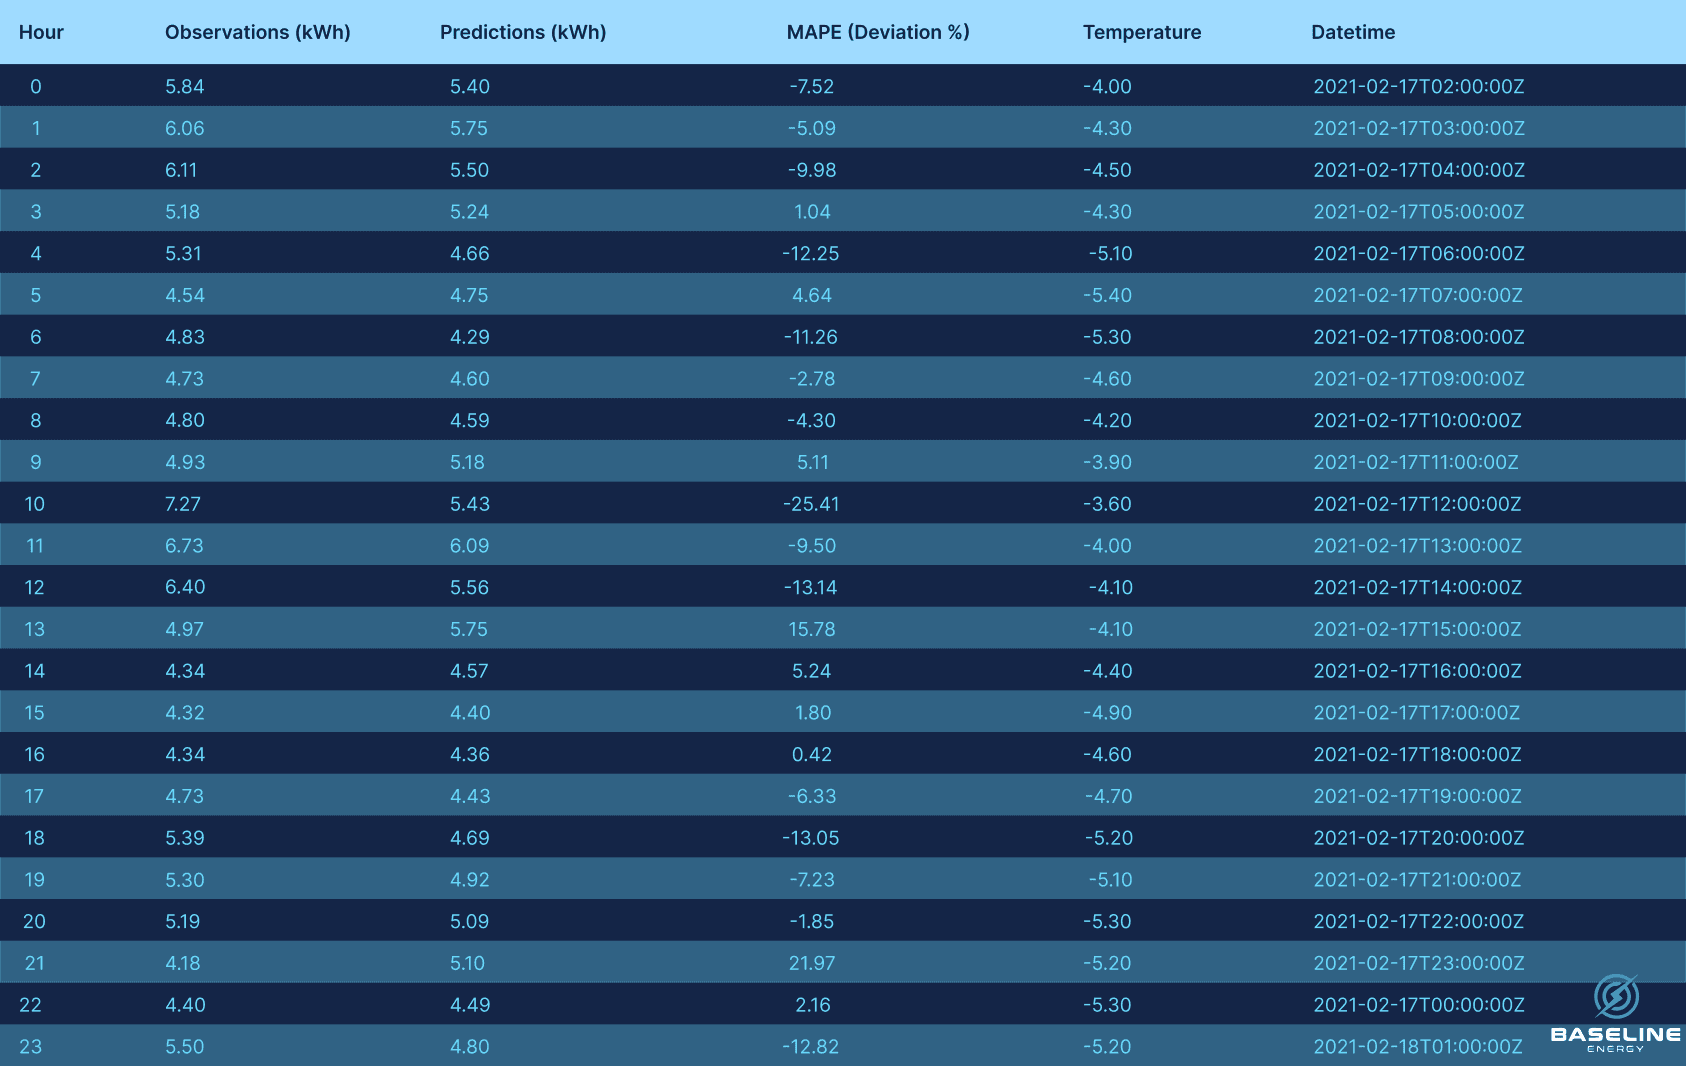
1. Data Preparation and Model Training
The challenge was to work with complex Excel datasets: clean the data, organize it properly, and identify meaningful features. Based on this, we had to prepare the datasets and train the model.
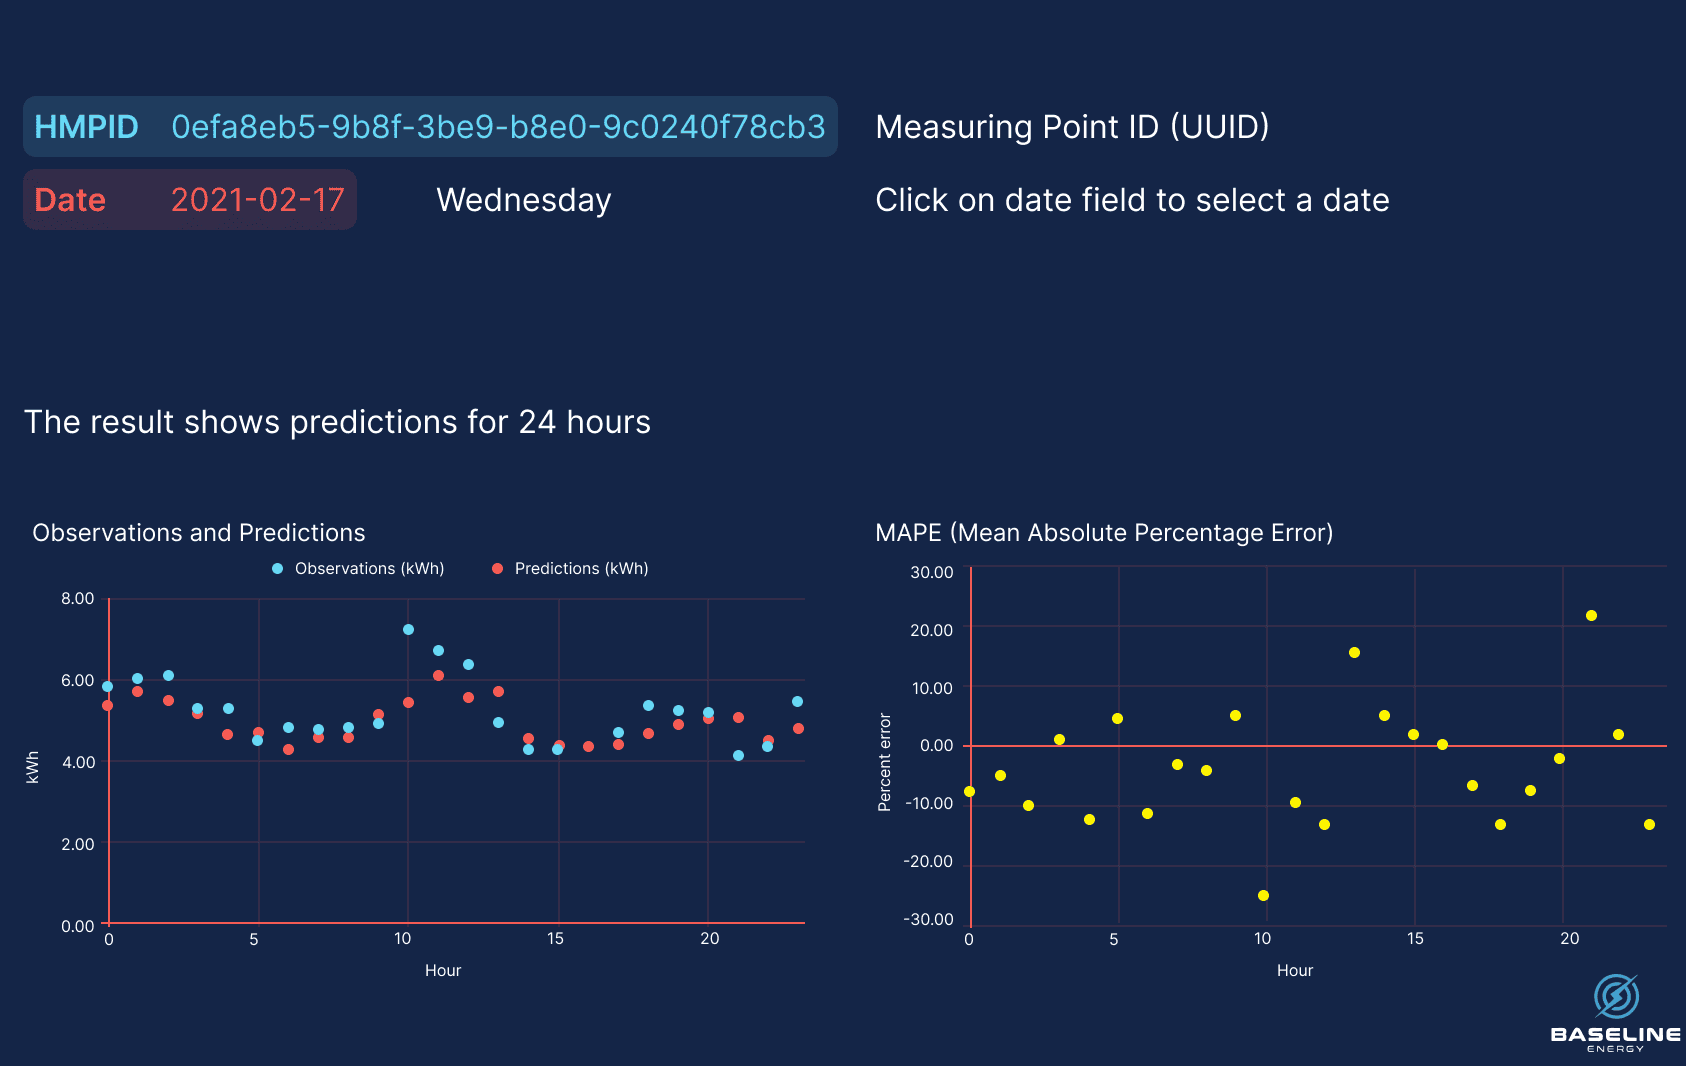
2. Forecast Accuracy
The second challenge was to improve hourly forecast accuracy. To do that, we had to compare the model’s predictions against the current accuracy level after training. If the model could exceed the existing 92% benchmark, the client’s goal would be achieved.
How We Trained the Forecasting Model
Step 1. Data Collection
Baseline Energy provided two years of historical data on energy consumption and load. We treated weekends and holidays as distinct patterns and incorporated weather data to better capture seasonality and weather-driven demand.
Step 2. Data Processing
Using Python, we brought the data into a consistent format, selected the most relevant features, reduced dimensionality of the data, and prepared the datasets.
To streamline the analysis, we used standard libraries for data processing and modeling:
– Scikit-learn for preprocessing and regression tasks.
– PyOD for outlier detection to identify anomalies that could distort the results.
Step 3. Model Execution and Evaluation
We selected the model architecture, trained it, and ran it on the prepared datasets. The trained model was then tested on new data provided by Baseline Energy.
We compared the model’s predictions against both the client’s manual forecasts and the actual energy consumption over the same time periods.
Step 4. Model Validation and Results
We validated the model on both training and test datasets to ensure it was not simply memorizing historical values but could correctly generalize consumption patterns.
Across different MPIDs, the Kullback–Leibler divergence ranged from 0.01 to 0.05, indicating stable model behavior and consistent generalization without overfitting.
Technologies

Backend
Python

Backend
Django
Machine Learning
Scikit-learn

Machine Learning
XGBoost

Database
PostgreSQL

Infrastructure
Google Cloud Platform
Result
We developed the Baseline Energy Application Service (BEAS), an energy consumption forecasting system that increased forecast accuracy to 96%. This allowed the client to plan electricity procurement more precisely and reduce operational costs.
BEAS is an ML-based system with an API that:
- collects and visualizes actual energy consumption across all client facilities;
- generates hourly forecasts for each Measuring Point ID (MPID);
- accounts for grid structure through Grid Location IDs (GLID) and related parameters.
forecast accuracy achieved.
Orange line – actual data.
Yellow line – BEAS predictions.

What happens next:
Having received and processed your request, we will reach you shortly to detail your project needs.
After examining requirements, our analysts and developers devise a project proposal with the scope of works, team size, time and cost estimates.
We arrange a meeting with you to discuss the offer and come to an agreement.
We sign a contract and start working on your project as quickly as possible.