Baseline power prediction service
Based on historical data, the model developed by us is capable of predicting the consumption of electricity by the population.
This project was for a Norwegian company that supplies electricity to the public. Based on historical data, the model developed by us is capable of predicting the consumption of electricity by the population. The aim of the project is to optimize energy consumption.
The Baseline energy application service (BEAS) is a Machine Learning System (MLS) with an API where business intelligence like baseline (the normal amount of kWh) and predictions for MeasuringPointIDs (MPID) and Grid Location IDs (GLID) are provided.
Using Historical Power Consumption data and Historical weather data we developed functions that have added the following parameters: A number of the most relevant pairs of temperature-energy values, an average value of the temperature-energy ratio for each hour for the current month, and the presence of a national holiday/weekend on a specific day.
We taught our model on a large dataset that included air temperature on a current day and the amount of electrical power that was consumed that day. In addition to the raw data, we have added some contextual functions. As a result, we have achieved a very good statistical representativeness of the predictions:

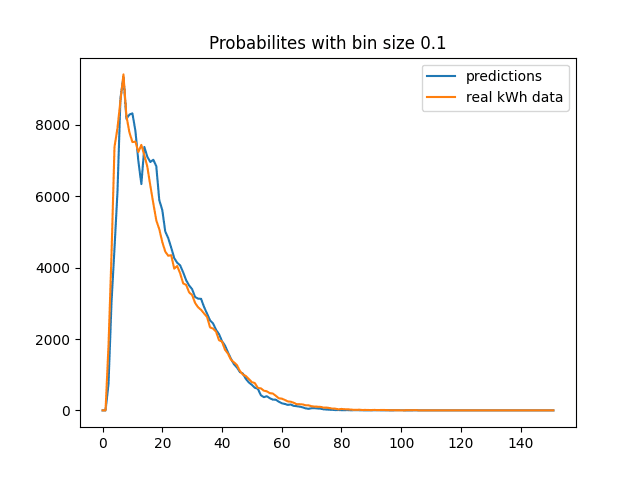
On the figure above there are plots of two discretized distribution functions based on a large data set. Discretization is based on the principle of dividing the full range of values into “baskets’’ with a size of 0.1 kWh, the size of which is then calculated as the number of values that fell into them from a statistical sample of real data (orange curve) and predictions (blue curve). The values of the Kullback-Leibler divergence metric on the training and test samples for different MPIDs were in the range of [0.01, 0.05], which also signals the qualitative statistical convergence of the algorithm.
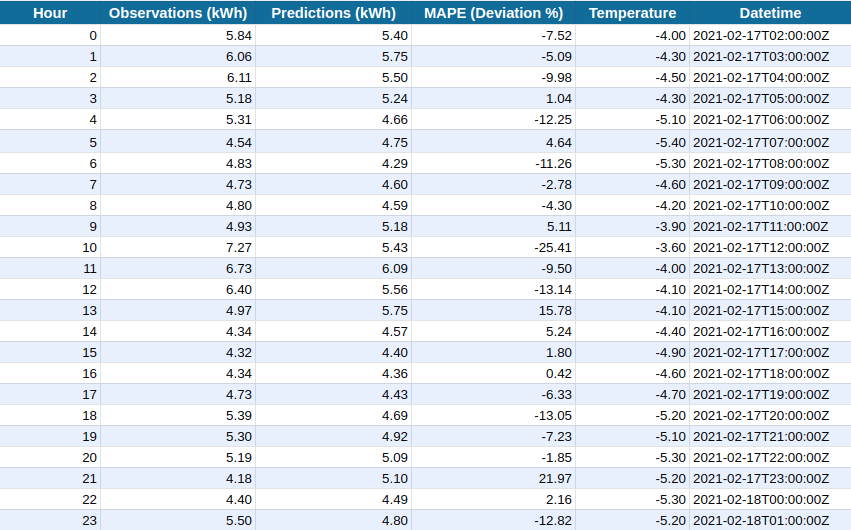
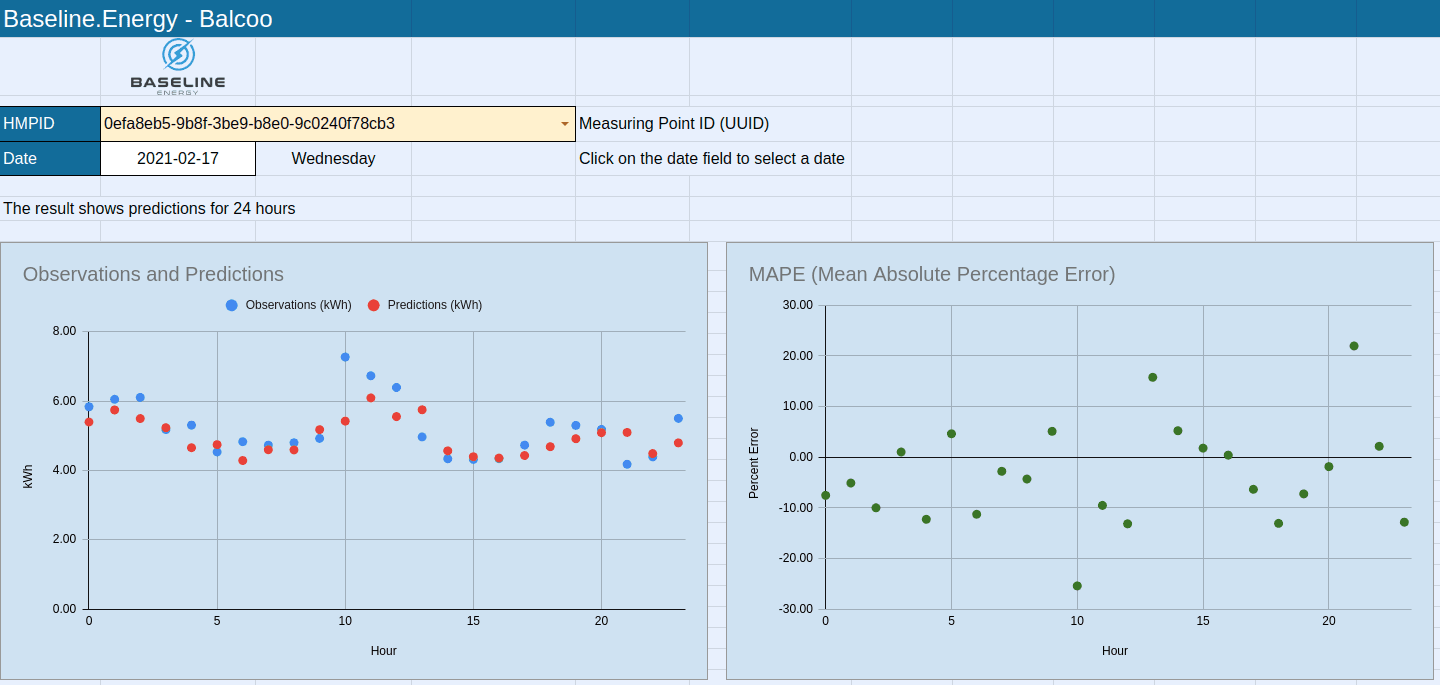
The table and a graph below demonstrate the result of the work made by our team.
The columns in the table mean:
- Hour - the hour at which the event occurs.
- Observations (kWh) - the amount of energy based on historical data.
- Predictions (kWh) - the amount of energy predicted by the system.
- MAPE (Deviation%) - deviation. For convenience, a “-” sign has been left, which indicates whether a deviation was made to the smaller or larger side from the observations.
- Temperature - air temperature.
- Datetime - date and time

Data from the table is presented in the graph below.

Technologies that we used for this project:
Python, sklearn, XGBoost, Django, outliers detection, PostgreSQL, Google Cloud Platform.
Similar Projects
Complex solution for oil consumers and suppliers
The platform for consumers and suppliers of oil and petrochemicals to set a feasible connection between them.
Virtual try-on tool for makeup products
The system consists of a face detection and segmentation model and an algorithm that allows recoloring objects without losing their original texture.
Online sign language interpreter
AI algorithm that converts video of a person using sign language into a text transcript