Model for oil platforms
Failure resistance simulation and maintenance strategy optimization for oil platforms
The project goal was to simulate gas diffusion in case of possible leaks and to model a failure resistance to prevent them on oil platforms. Maintenance strategy optimization was done using Petri nets.
Software solution for the problem consisted of 2 components:
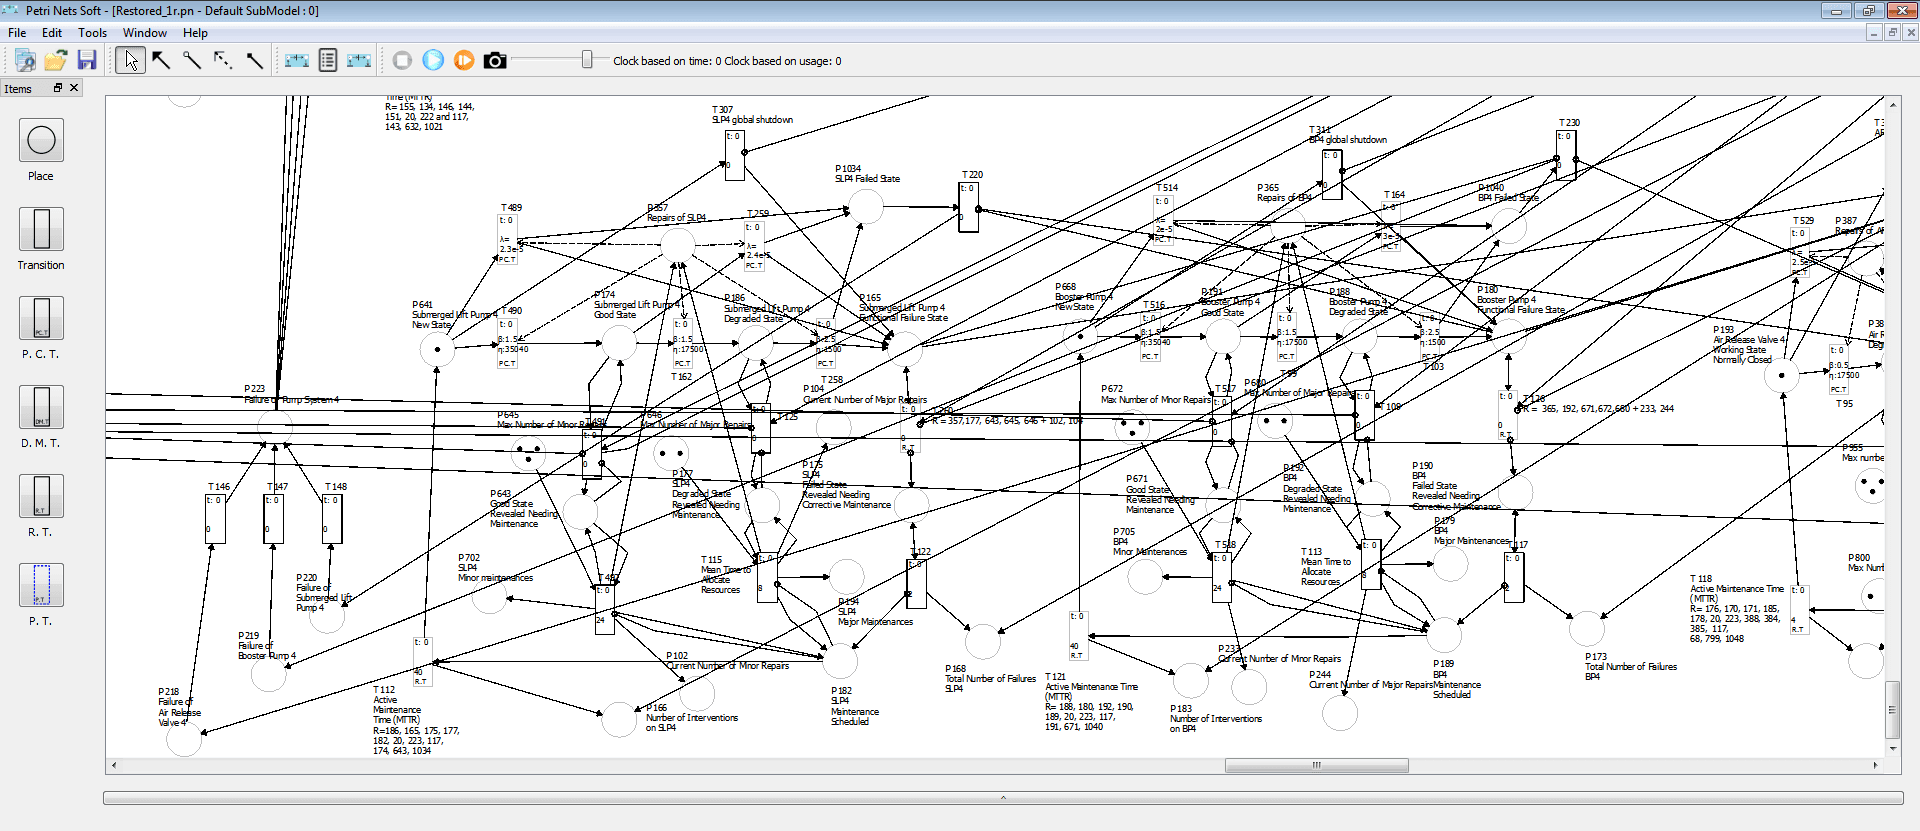
- Qt-based C++ application for Petri net simulation and modeling;
- Matlab code for processing, analyzing and simulation based on generated data.
The simulation solution was based on an existing open-source application for Petri Net simulation. The application was configured in order to satisfy the goals of the project, thus additional transition types for the model had to be integrated.
As a result, the new versions allow using an extended set of probability distributions for events: uniform distribution, normal distribution, exponential distribution, Weibull distribution, etc.
Another group of modifications was related to visual representation of elements and editing options in a large network:
- grouping functionality for a set of elements representing a single module in the platform. It produced a more convenient way of displaying and editing a network.
- status window to monitor a state of specific modules in a simulation A user is able to select groups and information he would like to control. After that, he can evaluate a state of the platform without a detailed analysis of simulation data.
- visual components for fast modification of network element properties in a large network.
Additionally, we’ve developed Matlab script for analysis of data produced during simulation.
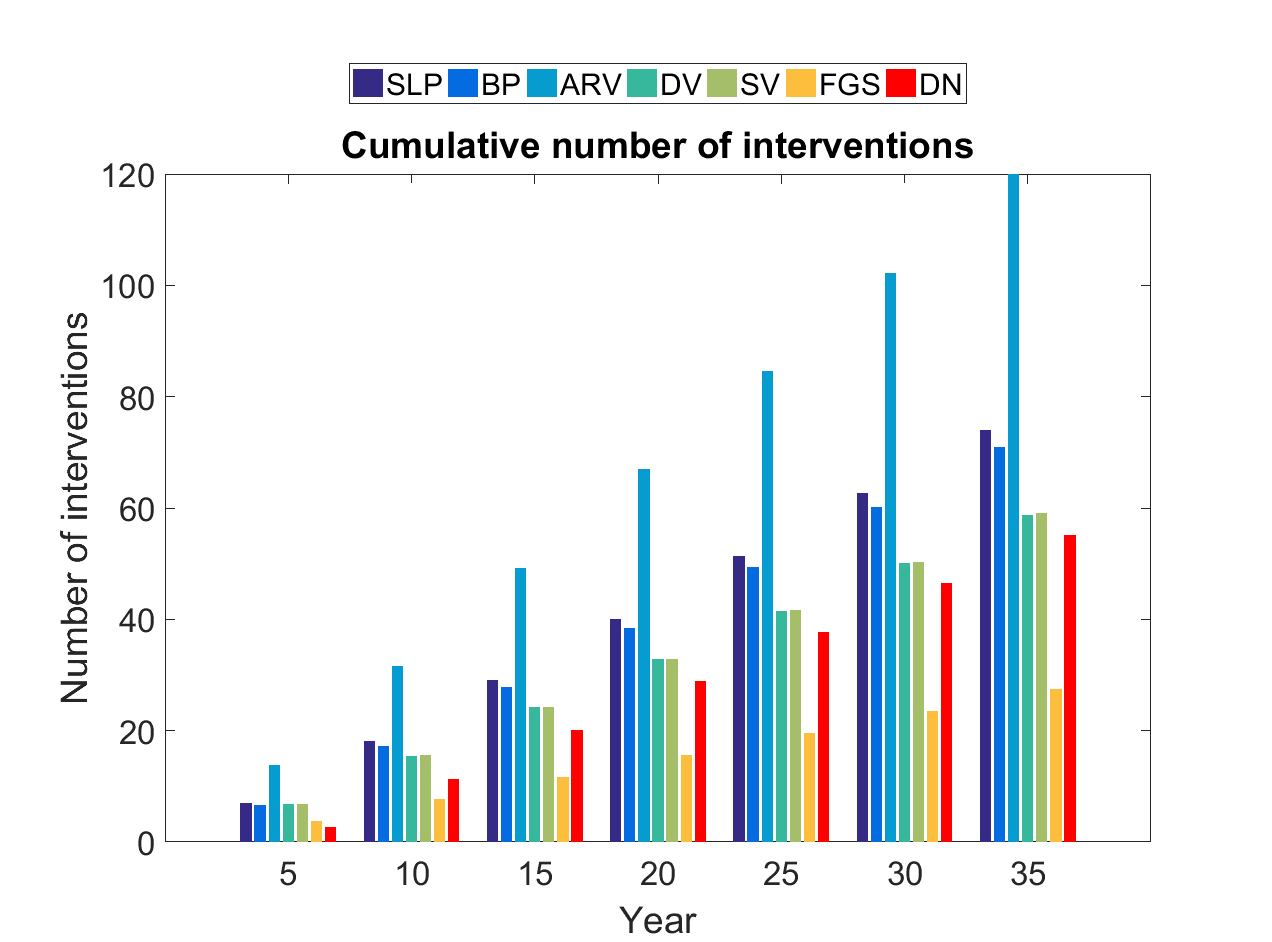
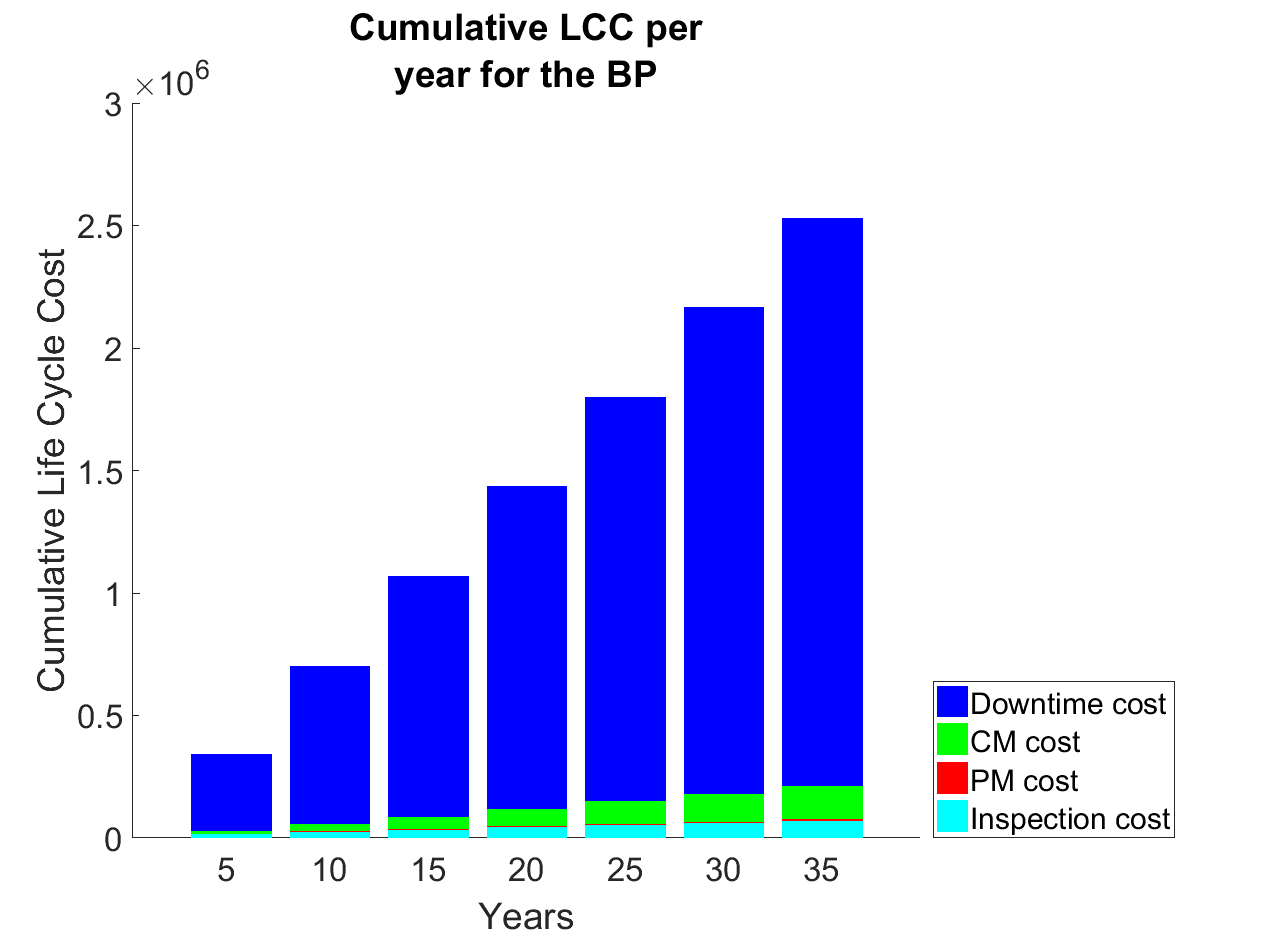
The script collects information about block states during simulation of a 35-year process. This data allows estimating an average working time for various types of equipment, maintenance cost, stability degradation over years of work, frequency of possible dangerous events (explosions and fires) using a special probabilistic model. The results are automatically converted to visual forms: plots and summary tables.
After analyzing a set of benchmarks it was decided to integrate an optimization algorithm. It was applied to automatic generation of optimal strategy and was aimed at reducing the cost of system operation and a frequency of failures. Selection of parameters for optimization was done in a semi-automatic way by estimating sensitivity of a system to parameters variation. Optimization procedure was implemented based on multi-objective genetic algorithm.
A number of various reports and plots were made to demonstrate convergence of the algorithm and resulting Pareto-frontier.
- Optimization,
- Genetic programming,
- Statistics,
- Visualization


Similar Projects
Virtual try-on tool for makeup products
The system consists of a face detection and segmentation model and an algorithm that allows recoloring objects without losing their original texture.
Online sign language interpreter
AI algorithm that converts video of a person using sign language into a text transcript
API driven statistics dashboard
We’ve developed a web-based dashboard showing statistics data. The dashboard is being frequently updated to provide the most actual data on the stores’ inventory condition.